Ross Young
Ross.Young@DisplaySupplyChain.com
FOR IMMEDIATE RELEASE: 03/04/2019
DSCC Releases Q1’19 Capex and Capacity Forecasts - Fab Delays Impact 2019 Spending
Austin, TX -
Display Supply Chain Consultants (DSCC) has distributed its latest capex and capacity forecasts to its Quarterly Display Capex and Equipment Service customers.
Some of the key highlights include:
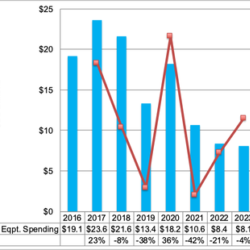
- In 2018, display equipment spending fell 8% to $21.6B, the second highest result in the history of the display industry. OLED fab spending fell 7% while LCD fab spending fell 10%, with OLEDs accounting for a 58% share. China dominated spending with a 92% share fueled by national and local government subsidies. The top 5 equipment suppliers for 2018 were AMAT, Canon, Nikon, Tokyo Electron and ULVAC. DSCC will reveal the top 20 later in the month.
- In 2019, a 38% decline is predicted to $13.4B on a number of fab delays resulting from weakening market conditions, funding challenges or other issues. LCD fab spending is expected to be down 9% Y/Y with OLED spending down 59% worsened by poor mobile OLED fab utilization. LCDs will account for 61% of spending and 2019 is the last year in our forecast where LCDs should lead in spending. China is expected to maintain a 92% share.
- As a result of the 2019 delays, 2020 is expected to rise by 36% to $18.2B, the 4th highest spending total in the history of the display industry. OLED spending is expected to rebound, rising 111% with LCDs down 10%. OLEDs will account for a 60% share. Companies spending over $1B in 2020 include LGD, BOE, CSOT, EDO, SDC and Visionox with China’s share falling to 82% and Korea’s rising to 18%.
- Volatility is expected to continue into 2021 with spending down 42% that year to $10B with OLEDs down 40% and LCDs down 45%. OLEDs should lead with a 62% share and China’s share should fall to 76% with Korea at 24%.
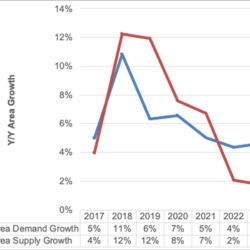
According to DSCC CEO Ross Young, “One impact of the 2019 delays is that the duration and the intensity of the large-area display over-supply is reduced, which should lead to slower price reductions and better returns for display companies. This issue addresses 10 different next generation TV technology alternatives which could slow down production decisions in the 2021-2024 period adding to the uncertainty in this period and potentially creating shortages. DSCC is currently predicting just 2% Y/Y growth in capacity in 2022 and 2023 as a result of conversions to more process-intensive technologies as well as delays in placing bets on next generation technologies until they mature. Companies are looking for a lower cost, emissive technology. However, many of these technologies are dependent on material advances which are difficult to predict. Display manufacturers must also monitor the progress of microLEDs which could eat up some of their market. As a result, there is the potential for tight capacity and even shortages from 2022”.
The highly sortable pivot tables extend to 2025 and reveal spending by manufacturer, frontplane technology, backplane technology, application, glass size, equipment segment all on a bookings and billings basis and even identifies the supplier of each equipment type at each fab along with the number of units and ASPs for each equipment type at each fab. 7 different module, metrology and color filter equipment segments will be added to the existing 40 segments later in the year.
Other highlights of the report include:
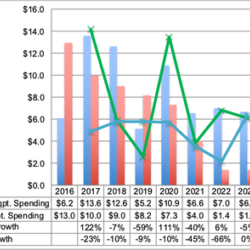
- Display equipment bookings fell 25% in 2018 to $17.5B, but are expected to rise 6% in 2019 to $18.5B on stronger 2020 deliveries. The 2019 book to bill should reach 1.39.
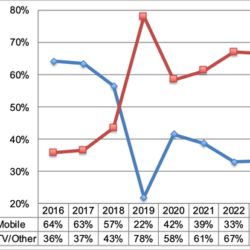
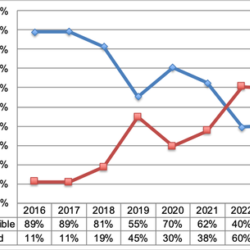
- While equipment spending for mobile displays dominated the past 3 years, TVs are expected to dominate the next 5 years with a 58% - 78% share on OLED TV/QDOLED/10.5G LCD TV and other TV technology investments. Given the much higher share of TV capacity relative to mobile and demand for better performing TV technology and current large surpluses in mobile displays, this is not a surprise. From 2018-2023, TVs are expected to lead with a 60% to 40% advantage after accounting for just a 39% share from 2016 – 2018. 2019 is particularly TV dependent with TVs accounting for a 78% share. In the case of just OLEDs, we see a similar trend with TVs accounting for just a 7% share of 2016-2018 spending, a 41% share of 2019-2021 spending and a 60% share of 2022-2023 spending.
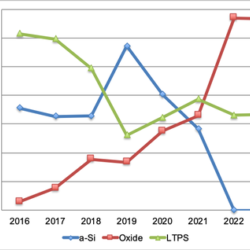
- Oxide backplanes are expected to gain a significant share of annual spending rising each year from just 3% in 2016 to 67% in 2022 and 2023. Oxide is gaining acceptance in LCD TV fabs for high refresh rate, 8K TVs, as a backplane in WOLED and QDOLED TV fabs and as a lower cost alternative to LTPS in mobile LCD and mobile OLED fabs.
- Flexible equipment spending dominated OLED equipment spending from 2016-2018 with an 86% share. However, from 2019-2021, the advantage for flexible over rigid will narrow to 64% to 36% % and in 2022-2023, rigid will lead with a 60% share as OLED TV spending takes share. For LCDs+OLEDs, rigid leads each year other than in 2017.
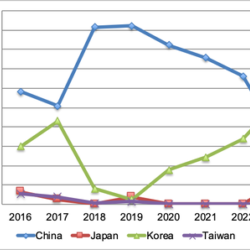
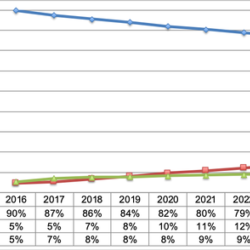
- By country, China is expected to lead from 2016-2022 helped by local and national government subsidies. In 2018, China accounted for 92% of display equipment spending and the same 92% share is predicted for 2019 as well. Korea is expected to bottom out in 2019 with LGD spending in China. However, Korea’s share is expected to rise through 2023 on spending for numerous OLED and QDOLED fabs from LGD and SDC and may even overtake China in 2023. In just LCDs, China is expected to be even more dominant, accounting for at least a 90% share each year from 2017 – 2023. From 2016 – 2023, China is expected to account for a 94% share of LCD equipment spending with Taiwan 2nd with a 4% share. In just OLED spending, while Korea led in 2016 and 2017, China is expected to lead from 2018 to 2022 with Korea regaining the top spot in 2023. From 2018-2023, China is expected to lead with a 59% to 37% advantage over Korea.
- We also provide a deep dive into display capacity. OLED capacity is expected to rise at a 24% CAGR from 2018 – 2023 with LCDs growing at just a 4% CAGR for a total display capacity increase of 5% to 388M square meters. OLEDs will reach 12% of display capacity in 2023.
- Unyielded mobile OLED capacity is expected to grow at a 16% CAGR vs. LCDs at 3% with mobile OLEDs overtaking LTPS/oxide in unyielded capacity in 2019 and reaching a 63% share in 2023.
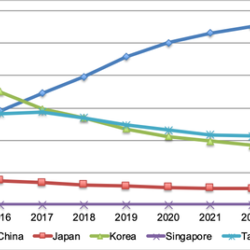
- China’s share of display capacity is expected to rise from 40% in 2018 to 55% in 2023 on a 13% CAGR. From 2020, China will have more than a 2X higher share than Korea or Taiwan.
- By backplane technology, oxide is expected to be the fastest growing technology rising at a 21% CAGR from 2018-2023, with its share rising from 7% in 2018 to 14% in 2023 and overtaking LTPS. LTPS/LTPO is expected to grow at a 9% CAGR while a-Si grows at just 3%.
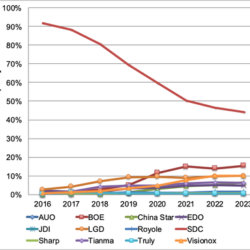
- BOE is expected to become the #1 display supplier on a capacity basis in 2019 and widen its advantage over LG and Samsung on significantly faster growth with BOE growing at an 11% CAGR, LG Display rising at 3% and Samsung down at a 7% CAGR from 2018-2023. BOE’s share will grow from 15.5% in 2018 to 20% in 2023. China Star is expected to edge Innolux to reach #3 in 2023.
- In total OLED capacity on an area basis, LG Display is expected to overtake Samsung in 2020 with BOE #3. In just mobile OLED capacity, Samsung will maintain a dominant position throughout the forecast, with its share not falling below 50% until 2022. BOE is expected to overtake LGD in 2020 for #2 with Visionox overtaking LGD for #3 in 2022.
For more information on DSCC’s Quarterly Display Capex and Equipment Service, please contact Gerry@displaysupplychain.com.
About DSCC
DSCC, a Counterpoint Research Company, is the leader in advanced display market research with offices across all the key manufacturing centers and markets of East Asia as well as the US and UK. It was formed by experienced display market analysts from across the display supply chain and delivers valuable insights, data and supply chain analyses on the display industry through consulting, syndicated reports and events. Its accurate and timely analyses help businesses navigate the complexities of the display supply chain.