Quarterly All Display Fab Utilization Report
Report Summary
DSCC's Quarterly All Display Fab Utilization Report takes into account the financial performance of many equipment and material manufacturers that are directly involved in FPD manufacturers' production line utilization rates. It reveals quarterly production capacity and glass substrate input for all OLED and LCD production lines. Information is presented on a quarterly basis and forecast data for the relevant calendar year is also provided.
-
Pages
32 -
File Format
Excel (Market Data) + PDF (Analysis of Data) -
Published
Latest Edition - April 2024 -
Order Report

Report Details
DSCC's Quarterly All Display Fab Utilization Report takes into account the financial performance of many equipment and material manufacturers that are directly involved in FPD manufacturers' production line utilization rates.
It reveals quarterly production capacity and glass substrate input for all OLED and LCD production lines. Information is presented on a quarterly basis and forecast data for the relevant calendar year is also provided.
The capacity and utilization data is provided through a series of pivot tables covering glass capacity and input in sheets and area.
- Production Capacity – sheets and area
- Input – sheets and area
- Utilization Rate – sheets and area
The utilization data can be segmented by:
- Supplier
- Country
- TFT Generation
- Backplane (a-Si, oxide, LTPS)
- Frontplane (LCD, OLED)
- Substrate type – rigid vs. flexible vs. foldable
In addition to the pivot tables, analysis is provided through a PDF report.
Areas Covered:
- Capacity, glass input and fab utilization by quarter for all OLED and LCD fabs
- History by quarter
- Regions Covered:
- China
- Japan
- Korea
- Singapore
- Taiwan
- Sortable by:
- Supplier
- Country
- TFT Generation
- Backplane
- Frontplane
- Form Factor
- Fab Generations Covered:
- Gen 1 through Gen 10.5
Table of Contents
Historical Outlook on Utilization p.4
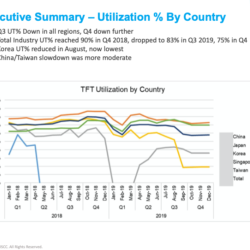
Executive Summary p.5
Methodology p.7
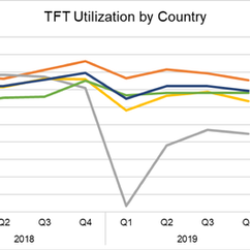
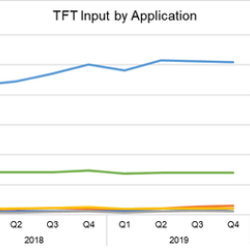
TFT Utilization % and TFT Input (p.8
- By Manufacturer
- By Display Technology
- By Backplane
- By Application
- By Gen Size
- Mobile Displays
TFT Utilization % by Fab for Gen 8.5+ (p.26)
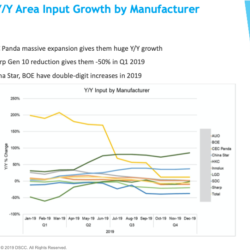
Y/Y Input Growth p.30
- By Manufacturer
- By Region
Report Samples