Quarterly OLED Supply/Demand and Capital Spending Report
Report Summary
This quarterly report is critical for every company in the OLED supply/chain. It tracks OLED and Micro OLED fab schedules, OLED unyielded and yielded capacity, OLED and Micro OLED equipment spending for >50 different equipment segments, OLED demand by application and OLED supply/demand for rigid OLEDs, flexible OLEDs, OLED TVs and AR/VR applications.
-
Pages
328 -
File Format
Excel (Market Data) + PDF (Analysis of Data) -
Published
Latest Edition - February 2024 -
Order Report
This report includes the following deliverables:
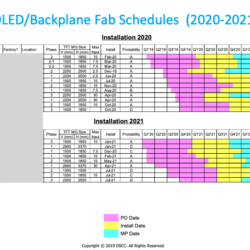
- OLED and Micro OLED fab schedules.
- OLED capacity by fab and form factor (foldable vs. flexible vs. rigid).
- OLED input capacity based on sheet and area, yields and panel output by fab.
- Unit, revenue and design win results and forecasts for all equipment in OLED frontplane and backplane fabs on both a bookings and billings basis.
- Market share for all OLED frontplane, backplane and most module segments.
- Powerpoint report covering:
- OLED capacity by form factor
- OLED fab schedules and supply analysis
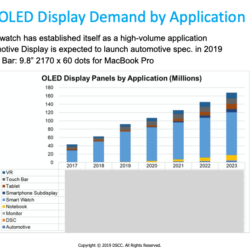
- OLED demand by application
- OLED supply/demand calculations and analysis
- OLED and Micro OLED equipment spending trends by equipment segment, panel manufacturer, country, fab generation, bookings basis vs. billings basis, etc.
- Equipment supplier market share for more than 50 different segments.
Table of Contents
1.0 Executive Summary p. 4
2.0 Methodology p. 13
3.0 Fab Schedules and Discussion p. 20
4.0 OLED Equipment Spending Trends p. 26
5.0 Supplier Market Share p. 48
6.0 TFT Backplane Supplier Share by Segment p. 51
7.0 OLED Frontplane Supplier Share by Segment p. 79
8.0 Module Supplier Share by Segment p. 96
9.0 Micro OLED Supplier Share by Segment p. 107
10.0 Appendix p. 117
10.1 Micro OLED Challenges
10.2 G8.7 OLED and Tandem Challenges
10.3 OLED Materials Developments
10.4 CoE Developments
10.5 OLED Photo Patterning Developments
10.6 OLED TV Developments
10.7 Latest Smartphone and IT OLED Technology Roadmaps
Report Samples
Recent Media Mentions
- Q2 OLED Supply/Demand Update – Oversupply in Phones to Persist to 2025
- DSCC Reveals OLED Equipment Supplier Rankings and Share for 56 Different Segments and >90 Suppliers
- Outlook for Flexible, Foldable and Rigid OLED Yields and Unyielded and Yielded Capacity
- Q3 OLED Supply/Demand Update – Oversupply in Phones to Persist to 2023